Showing posts with label real life links. Show all posts

Monday, 3 December 2018

Advent Maths

So, this year (2018), 1st December was on a Saturday. Doors opened on Advent calendars all around the land. Go to church on 2nd December and they're lighting their candle and saying that it was the first day of Advent.

So,

There are four Sundays in Advent. The four Sundays leading up to Christmas Day.


Sunday, 10 June 2018

Sporting Number Bonds

Last month, I was at a football match. The team I support were winning, for a change. As a result, I was clock watching for most of the second half. As time went on, I realised that my Number Bonds to 90 are pretty good.

Too often in school, we focus on Number Bonds to 10 and to 100. This is all good and well, but it's not enough. The children need to know their Number Bonds WITHIN 100. This then aids their addition and subtraction greatly. They need to know all 288 X and ÷ facts, and in the same way, they need to know these sum/difference facts within 100. For example, 5 and what make 13? 15 add 7 is? 23 added to 19? 44 subtract 17?

Here's an idea. 
Like I was, use the scenario of a sporting event to help:
Football: Number Bonds to 45/90
Basketball: Four 12 minute quarters
Cricket: Number Bonds to 6 (overs), 40/45/50 (game length)
Netball: 60 minutes, divided into 15 minute quarters
Ice Hockey: 60 minutes, divided into 20 minute thirds
Rugby Union: Number bonds to 40/80 

Saturday, 20 January 2018

Supermarket Maths

It's a quick one...


Supermarkets are full of maths, well everywhere is. You're probably walking around with your phone in your pocket. Snap some maths starters or additions to your lessons. they'll be a real life link. We've started here.

Tuesday, 9 January 2018

Minecraft and Rocks and Soils

We recently taught some of our introductory work for our science module on rocks and soils. As part of this discussion, we were discussing that rocks from under the soil can be seen around the world. To demonstrate this we nipped into our Minecraft world and had a fly around. Within the game, we were able to see places where rocks appeared above ground.
Then we did some digging under the soil and discovered rock below the surface.


Finally, we even managed to show how igneous rock is formed by pouring water on lave to make obsidian.

Of course we used lots of other real world resources showing how rocks are really formed, what lava and magma are and different types of rocks, but it was engaging for the children and, more importantly, linked to a context that they understood. A number of children went, "Oh yeah, I've done that" once they got over the fact that obsidian was a real life rock. Next step is to try and build a portal in the classroom.


Friday, 17 March 2017

The Story of the Rugby Match

In rugby (union and league), points are earned in various different ways during a game. 

Here's the scoring system in rugby union:
- try, 5 points (and then the opportunity to kick a conversion for 2 points);
- penalty, 3 points;
- drop goal, 3 points (not frequent).

So, looking at a scoreline from a game, can pupils work out how the teams achieved the scores they have? These could be mid-game (like the ones below), full time or even fictional.


Are all scorelines possible? Can any scores only be gained in one way?

Tuesday, 8 March 2016

Impossible Darts Checkouts

Recently, I was watching a game of darts on the television. I don't watch or play much darts. The commentator mentioned something I'd not realised before. The player at the oche was on a total of 165, resulting in the commentator saying, "That's unlucky, 165 is one of the numbers that can't be made with a three-dart checkout." I immediately thought about how I could use this in a maths investigation. 


With a bit of research, I found this list of possible darts checkouts. And, I made the following resource to explain the investigation. Today, some of my Year Five children successfully completed the investigation and found it to be an 'interesting challenge'.

Tuesday, 14 July 2015

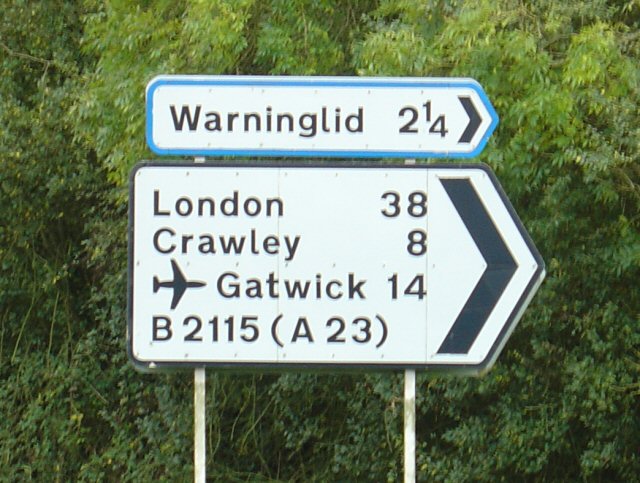
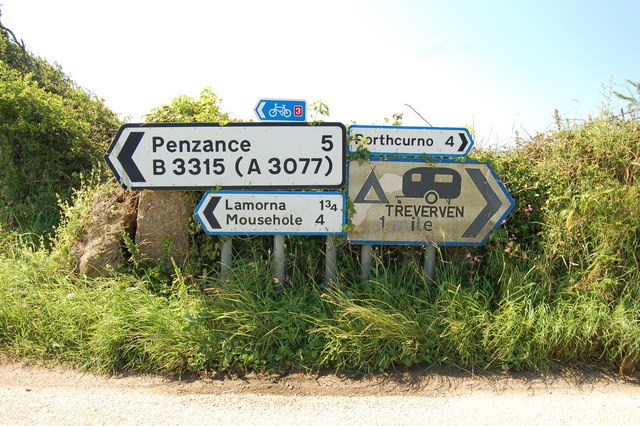
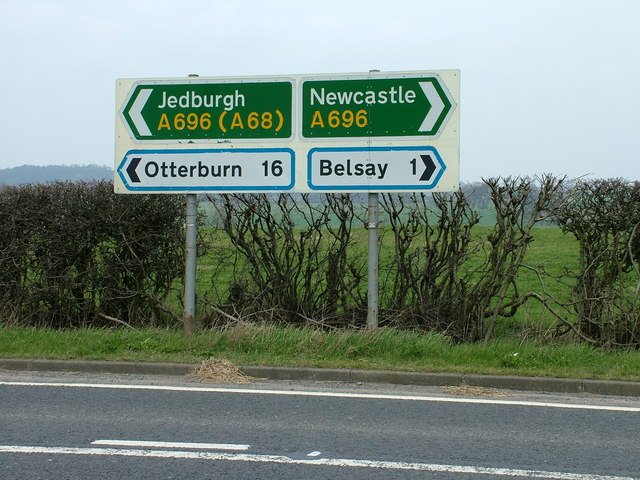
Road Sign Angles

In the past we've used roller coasters as a real-life link and vehicle for studying angles in maths. When driving to work last week, I started to wonder about angles I could see on road signs...

It started with the 300, 200, 100 yard marker boards: "What angle are they at?"


Next, on the the directional signs, "Are the two obtuse angles on the end of the smaller are larger signs the same measure?"


Are there similar or same angles in lots of road signs? 

As of September 2007, 'Traffic Signs'.

Due to the responsible nature of my driving, I chose not to take photographs of the road signs whilst driving. These images came from a Creative Commons image search. However, next time I'm a passenger, I may snap some of my own. 


Saturday, 26 April 2014

Averaging Speed in Maths

Driving along, observing the speed limit and I entered a section of road covered by average speed cameras. I understand how these work and therefore know a driver should drive at a constant speed, at or under the speed limit, in order to avoid encountering a conviction. However, I observed a young lady speeding in between cameras and then slowing for each one. She clearly did not understand the term 'average'. This lead me to think about how 'average' could be taught using these cameras as a real life context.

I have two possible methods for carrying out this investigation:

One: Using the formula for calculating speed: Speed = Distance ÷ Time. Give the children a set of data. The data being that for time taken for drivers to travel the distance between cameras. The data can be put into the formula and then the children work out which motorists are within the limit and those who are not.

Image credit: www.walesonline.co.uk

Two: Giving the children the driver's speed in between each camera on a road and then the children calculate an average of those speeds. Again, from this the children work out which motorists are within the limit and those who are not.

The first idea is more in line with how the system actually works. However, the second would work better in a primary classroom for calculating averages. We've made a resource to accompany the latter.

Also: See Stuart's very useful and helpful suggestions below

Update: February 23, 2015


Tuesday, 10 July 2012

The Angles Roller Coaster

We believe that to give learning purpose and ignite interest it's important to link learning to real life situations. We have demonstrated this in some of our previous blog posts.

For this post we are looking at a real life situation for measuring and drawing angles in maths. We decided upon roller coasters as a good subject to base our lesson on. Roller coasters, after all, are all about angles!

Firstly, reading the angle of rises and falls on roller coasters involved looking at pictures of roller coasters. Then, drawing on lines to show the angle to be measured and then measuring this angle. We discussed what angles made the best roller coasters and why different angles were used. Below is an example of this:

Next, came drawing angles. Using the knowledge gathered from the 'reading angles' lesson the children had a go at drawing their own roller coasters. They then peer assessed which roller coasters they liked the look of, which they did not and why:

 
Give it a go. See what stomach churning rides your class can come up with...

Sunday, 4 December 2011

Google Earth in Maths

I have used Google Earth a number of times in maths lessons. It has mostly been to make use of the 'ruler' tool and provide real life links to the lesson.
Ruler

The first use I've found for the ruler tool is for providing real life links to calculating area and perimeter. The ruler too can be used to measure the dimensions of the school playground, a football pitch (see below), a child's garden, the courtyard of Buckingham palace or even The Pentagon, anywhere really! This can be either as a whole class on an interactive display, with everyone calculating areas and perimeters based on the measurements taken or as individuals taking measurements on computers or hand held devices. As the ruler tool measures accurately it offers an opportunity to discuss rounding. Also, if calculating the area and perimeter of part of your school the activity can be carried out virtually on Google Earth and then in 'reality' by going out with trundle wheels and then comparing the two.


The other time I have used the ruler tool is when converting lengths. I've usually done this converting between centimetres, meters and kilometres, but it can also be used to practise converting metric to imperial or vice versa. The example below shows how the length of one side of the Pentagon can be measured and then converted into various different units of measure. The original measurement was taken in meters. I'd then ask the children to convert this to centimetres, kilometres or feet, inches etc., if covering converting to imperial measurements. Once the children have their answers one click of the button can quickly show them the measurement they should have arrived at. The measurement of 'Smoots' always causes some amusement and a good teaching point about less well known units of measure for length.

These are just some ideas I've made use of for using Google Earth in maths lessons. If you have some ideas of your own I'd love to have some comments below.

Update:


Images all credited to 'Google Earth': earth.google.co.uk